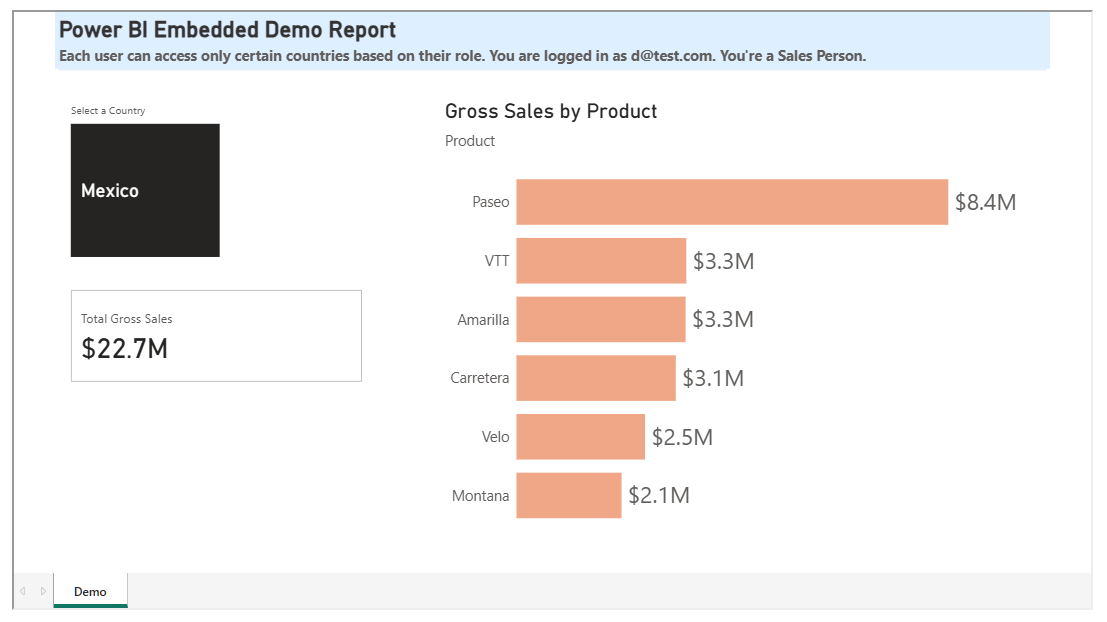
Power BI Embedded Demo
All other reports on my website use Publish to Web (unsecure way to publish public open-data and dummy-data reports). This one is a truly securely embedded Power BI report with Row-Level Security.
Power of Business Intelligence
Blog by Andrzej Leszkiewicz. Power BI Developer and Consultant.
Power of Business Intelligence
Blog by Andrzej Leszkiewicz. Power BI Developer and Consultant.
All other reports on my website use Publish to Web (unsecure way to publish public open-data and dummy-data reports). This one is a truly securely embedded Power BI report with Row-Level Security.