This report was created in 2020. I was an Excel VBA developer, occasionally using Power BI for simple tasks. COVID-19 changed everything. I devoted 2-3 months to working full-time on this report (reading about viruses, searching for data, cleaning the data, and then making and maintaining the report), relying on ads and donations (not substantial, but sufficient to get by). This period initiated my deep dive into Power BI and data visualization, and I never returned to Excel VBA. Instead I fully switched to Power BI and started reading books on data visualization.
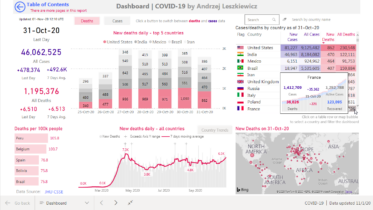
Looking back, I would handle some data visualization aspects differently today. However, during the early months of the pandemic, it was one of the world’s most comprehensive public COVID-19 reports, attracting tens of thousands of users daily.
Creating and maintaining this report required a lot of effort, particularly as data providers frequently changed data formats. I’m deeply thankful to everyone who supported my work, either financially or by providing valuable feedback. I’ve received many grateful messages from people worldwide. If this report has helped people understand the extent of the issue and make preparations that could potentially save the lives of their loved ones, then it is the best reward for me.
P.S. My family was prepared for the pandemic well before people in Poland recognized the seriousness of the situation. Many laughed when I inquired if they were ready for closed schools and kindergartens, overwhelmed hospitals, and various restrictions. Then the government closed even forests. The data do not lie, if you know how to interrogate it.
The report is no longer being maintained and data refresh is disabled, many pages (e.g. country specific dashboards based on additional data sources) have been removed.