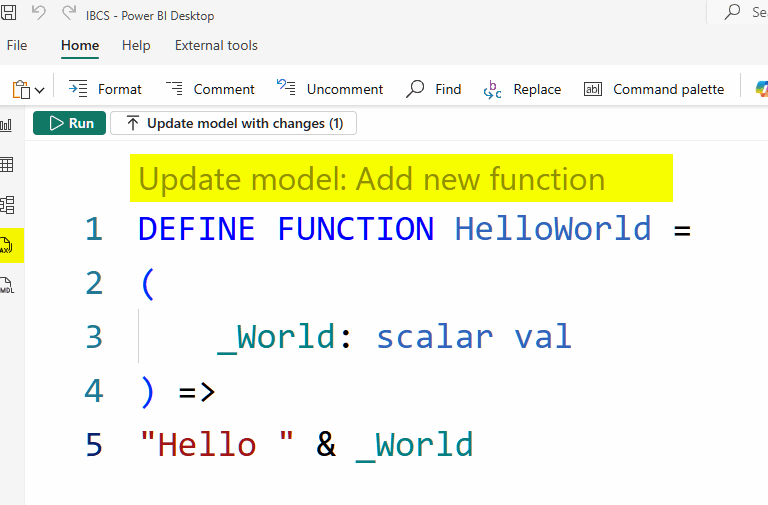
New DAX! User-Defined Functions
Now you can create your own DAX functions, reuse them in your reports, and share them with the community. Power BI Desktop: File | Options … Read More
Power of Business Intelligence
Blog by Andrzej Leszkiewicz. Power BI Developer and Consultant.
Power of Business Intelligence
Blog by Andrzej Leszkiewicz. Power BI Developer and Consultant.
Now you can create your own DAX functions, reuse them in your reports, and share them with the community. Power BI Desktop: File | Options … Read More
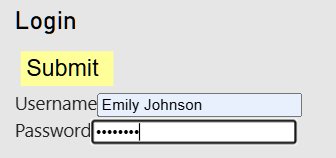
One more experiment with the Button Slicer: Row-Level Security (RLS)-based default slicer selection (for cases where security isn’t required but a default selection is desired). … Read More
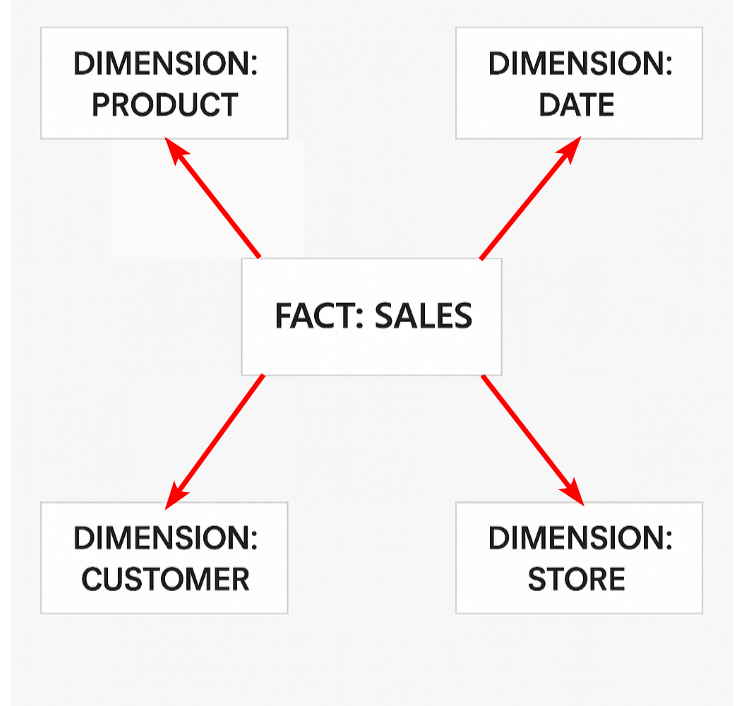
Power BI developers learn that a star schema is the optimal data model design for usability and performance. However, seeing an ideal “star schema” with … Read More
For now, this is just a quick proof of concept, but it works (at least it worked on my side). It consists of two C# … Read More
A data model is not a feature; it’s the core of a Power BI report. You can create a great report without using additional features … Read More
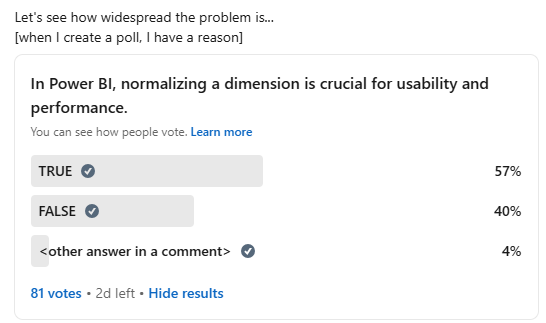
Okay, Power BI community, we have a problem. 80+ votes is already enough to confirm that we indeed have a problem. “In Power BI, normalizing … Read More
This post is an update for What is new? One of the users has found a critical issue in the old version of the report: … Read More
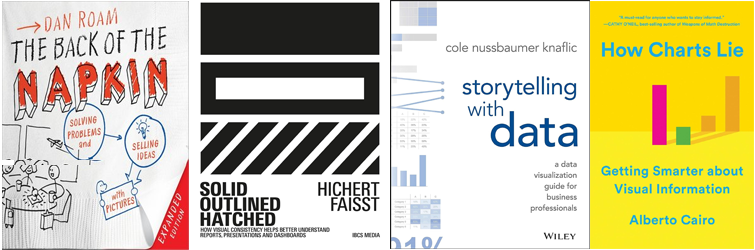
I recommend seeking an answer in the following books: Dan Roam’s “The Back of the Napkin” – an amazing book about solving problems and selling … Read More
➡ Do not hesitate to append (do not merge) data with different granularity/different facts into a single table. You’ll need a column that identifies what … Read More
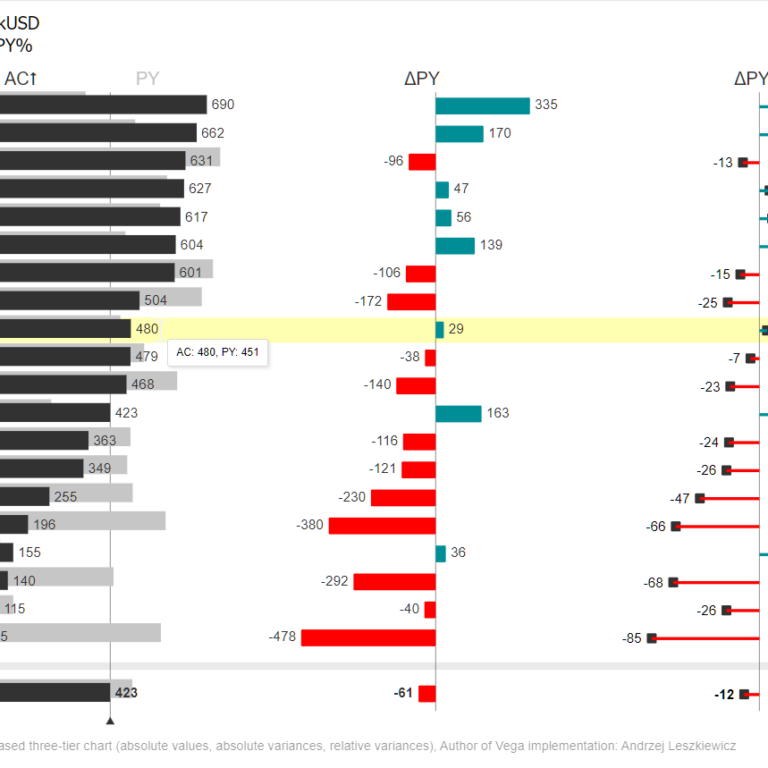
I’ve published a Power BI report with an example of a chart based on International Business Communication Standards. Live Power BI report: https://www.powerofbi.org/international-business-communication-standards/.