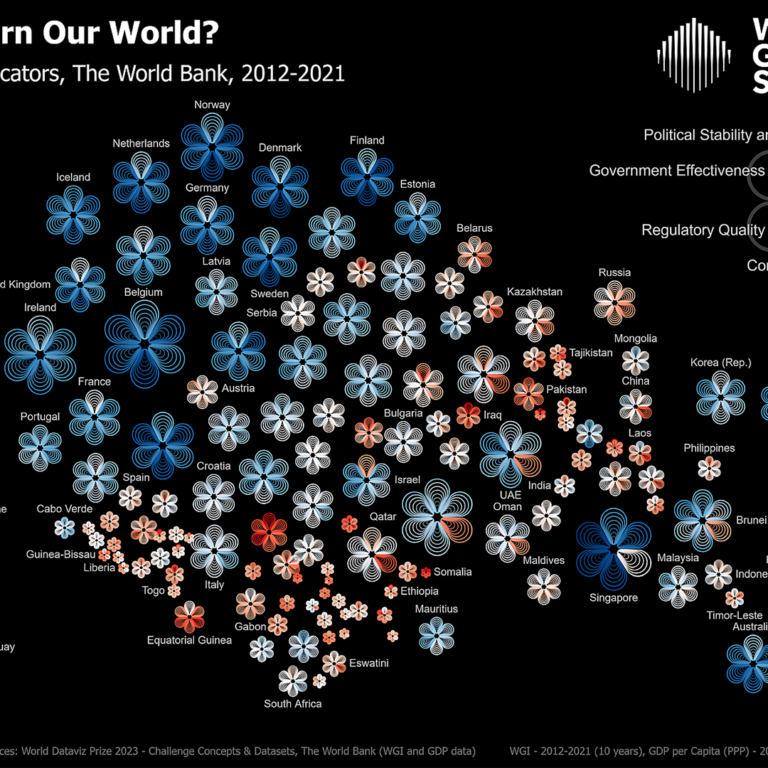
Floral Cartogram – How Do We Govern Our World?
This data visualization was included into the World Data Visualization Prize 2023 poster longlist. The poster displays Worldwide Governance Indicators for 170 countries. Each flower … Read More
Power of Business Intelligence
Blog by Andrzej Leszkiewicz. Power BI Developer and Consultant.
Power of Business Intelligence
Blog by Andrzej Leszkiewicz. Power BI Developer and Consultant.
This data visualization was included into the World Data Visualization Prize 2023 poster longlist. The poster displays Worldwide Governance Indicators for 170 countries. Each flower … Read More
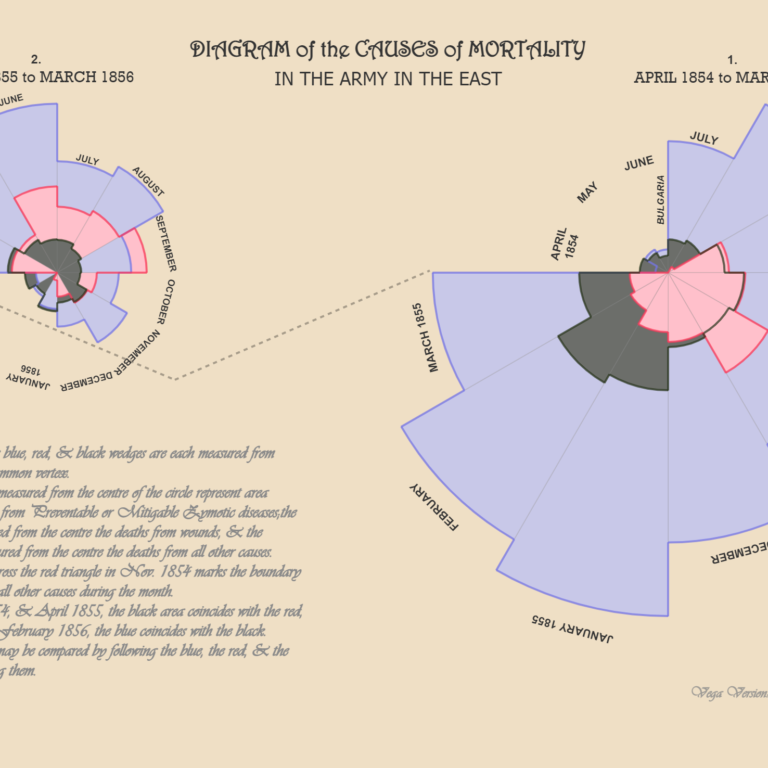
Florence Nightingale (12 May 1820 – 13 August 1910) was an English social reformer, statistician, and the founder of modern nursing. She gained prominence while … Read More
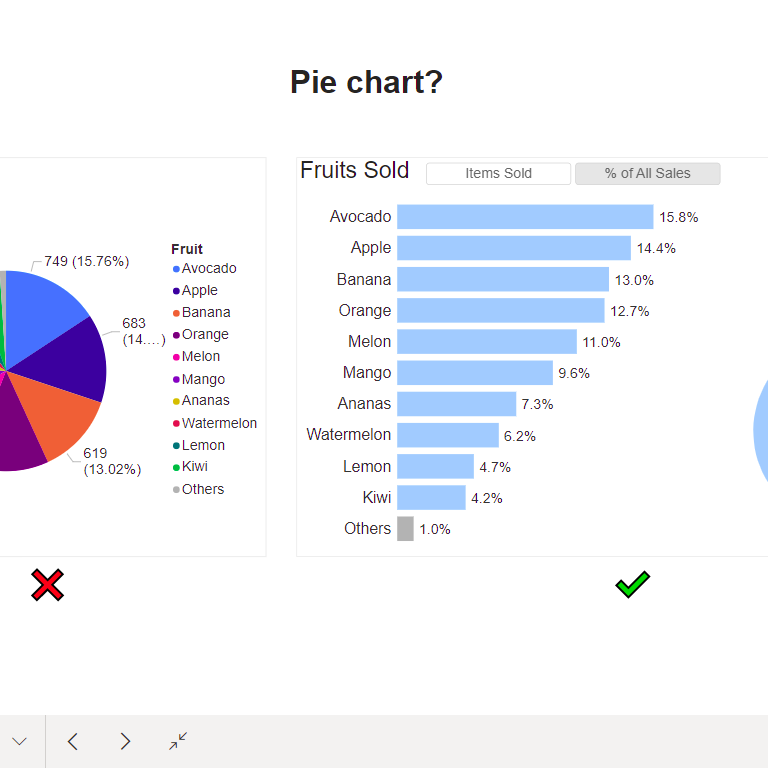
Updated version of my Pie Chart (how not to do) vs Not A Pie Chart (how to do) example. Now there is a Pie Chart … Read More
It is very disappointing to see 1-star reviews on Amazon page for this book. Someone bought a book about critical thinking (!!!) and left 1 … Read More
This books doesn’t require a lot of comments. It’s the DAX Bible. The Definitive Guide to DAX means what it says – it’s The Definitive … Read More
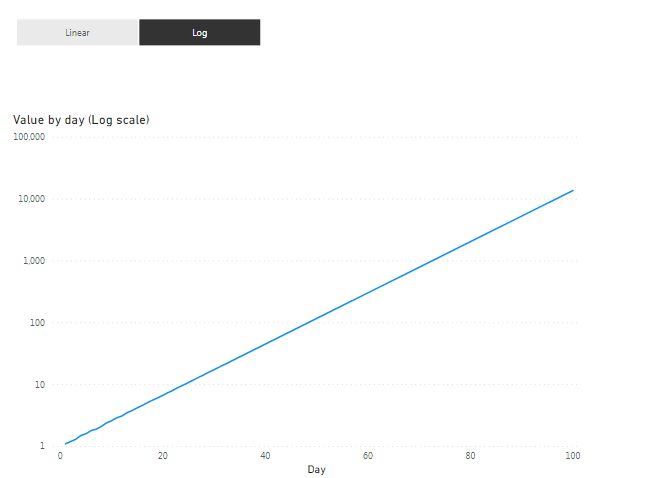
There are 2 ways to switch between linear and log scale: we can use bookmarks to switch between 2 different charts we can use DAX … Read More