Should You Build a Custom Power BI Visual?
You have a data visualization problem, and you believe that it requires a new vibe-coded custom visual for Power BI on the Marketplace; here is a checklist for you:
☐ Are you sure it’s a data visualization problem?
Are you going to visually highlight something important for the business or are you just trying to test your vibe-coding skills? Nothing wrong with the latter, just keep the objectives clear for yourself and the community.
☐ Are you sure what you want is about visualizing data and not about adding unnecessary decorations?
Rounder bars and cooler gradients? Does it help?
☐ Are you sure a native visual is not good enough?
If a simple bar chart doesn’t work, there are native features such as error bars and workarounds like white/transparent visual elements that allow, for example, turning a bar chart into a bar chart with a waterfall 2-tier chart.
☐ Are you sure embedding SVG into a native visual is not good enough?
If native features and workarounds are not good enough, consider embedding simple SVG into core Table, Matrix or Button Slicer. Are you sure your visualization will benefit from adding limitations and extra development and maintenance complications of creating a custom visual? If not, then consider using existing user-defined functions (DAX Lib package) or creating your own ones instead of a new custom visual.
☐ Are you sure Vega visualization in Deneb custom visual is not good enough?
I believe Daniel Marsh-Patrick spent a lot of time making sure Deneb is integrated into Power BI as seamlessly and reliably as possible. There is no reason for you to start building a new custom visual for each small data visualization problem, creating one more point of failure and maintenance debt. Instead of vibe-coding a new custom visual, spend more time tweaking and polishing a Vega specification.
☐ Deneb/Vega is not enough. You need capabilities missing in Vega. You need Format pane for all the custom options. And all those features are needed for solving a complex data visualization problem, not for creating a new version of a 3D-pie chart with cooler gradients. Create a custom visual, maintain and support it.
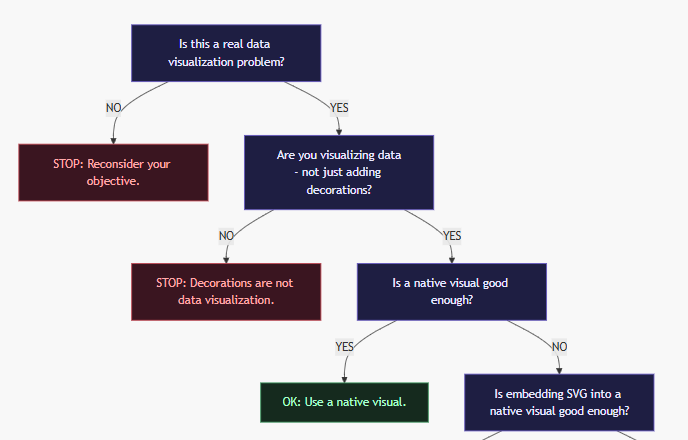
Should You Build a Custom Power BI Visual?
flowchart TD
    A["Is this a real data visualization problem?"]

    A -->|NO| S1["STOP: Reconsider your objective."]
    A -->|YES| B

    B["Are you visualizing data\n- not just adding decorations?"]

    B -->|NO| S2["STOP: Decorations are not data visualization."]
    B -->|YES| C

    C["Is a native visual good enough?"]

    C -->|YES| G1["OK: Use a native visual."]
    C -->|NO| D

    D["Is embedding SVG into a native visual good enough?"]

    D -->|YES| G2["OK: Create a UDF or DAX Lib package."]
    D -->|NO| E

    E["Is Vega / Deneb good enough?"]

    E -->|YES| G3["OK: Use Deneb."]
    E -->|NO| F

    F["BUILD: Build a custom visual.\nCommit to maintaining and supporting it."]

    style S1 fill:#3a1520,stroke:#c0424e,color:#ffffff
    style S2 fill:#3a1520,stroke:#c0424e,color:#ffffff
    style G1 fill:#152a1e,stroke:#3d9960,color:#ffffff
    style G2 fill:#152a1e,stroke:#3d9960,color:#ffffff
    style G3 fill:#152a1e,stroke:#3d9960,color:#ffffff
    style F  fill:#152a1e,stroke:#3d9960,color:#ffffff
    style A  fill:#1e1e42,stroke:#6354c0,color:#ffffff
    style B  fill:#1e1e42,stroke:#6354c0,color:#ffffff
    style C  fill:#1e1e42,stroke:#6354c0,color:#ffffff
    style D  fill:#1e1e42,stroke:#6354c0,color:#ffffff
    style E  fill:#1e1e42,stroke:#6354c0,color:#ffffff