The Real Power of the New Slicers
The Real Power of the New Slicers. Turn Your Slicers into Charts.
Power BI and Fabric Summit 2026. February 24, 2026, online (day 2, virtual room 2).
I speak about turning slicers into charts. This session will show you how to take your Power BI reports to the next level by turning charts into interactive slicers. Attendees will learn:
➡️ How to help report users slice for a reason
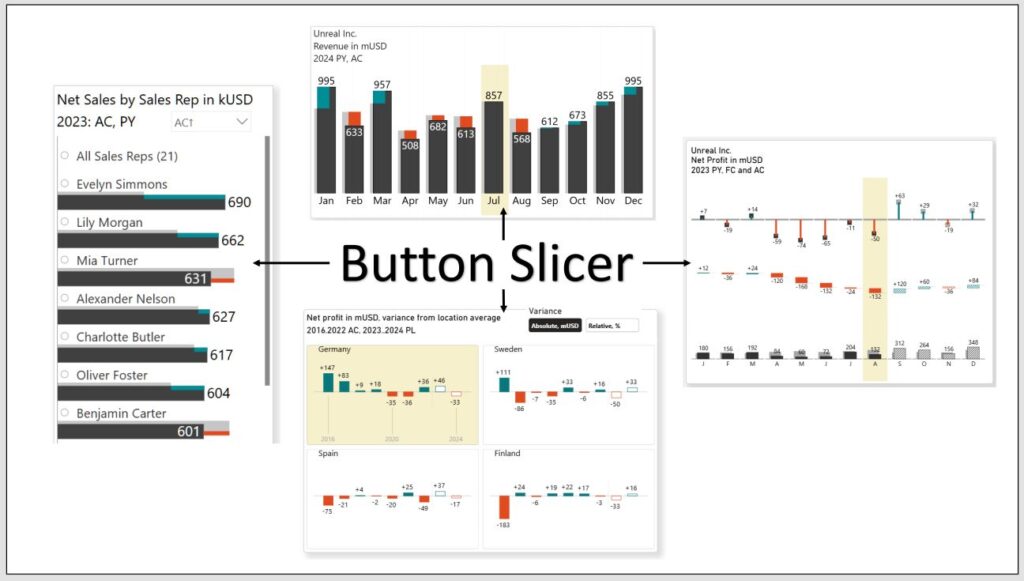
➡️ How to turn native slicers into interactive charts
➡️ How to use DAX to generate charts (as SVG images)
➡️ How to apply this approach to different chart types, including column charts, bar charts, and maps
➡️ How to add meaning and context to your slicers
➡️ How to improve the appearance and functionality of the slicers