Testing AI Reasoning: Converting SVG to Native Chart with Claude Opus 4.6
While everyone is using AI to replace core visuals with custom visuals using SVGs (I don’t like that trend), I do the opposite—turning my SVG visualizations into native charts. I could build that chart myself, but the goal is to test current AI capabilities with the PBIP format.

Image – original button slicer with SVG, created using my DAX Lib package.

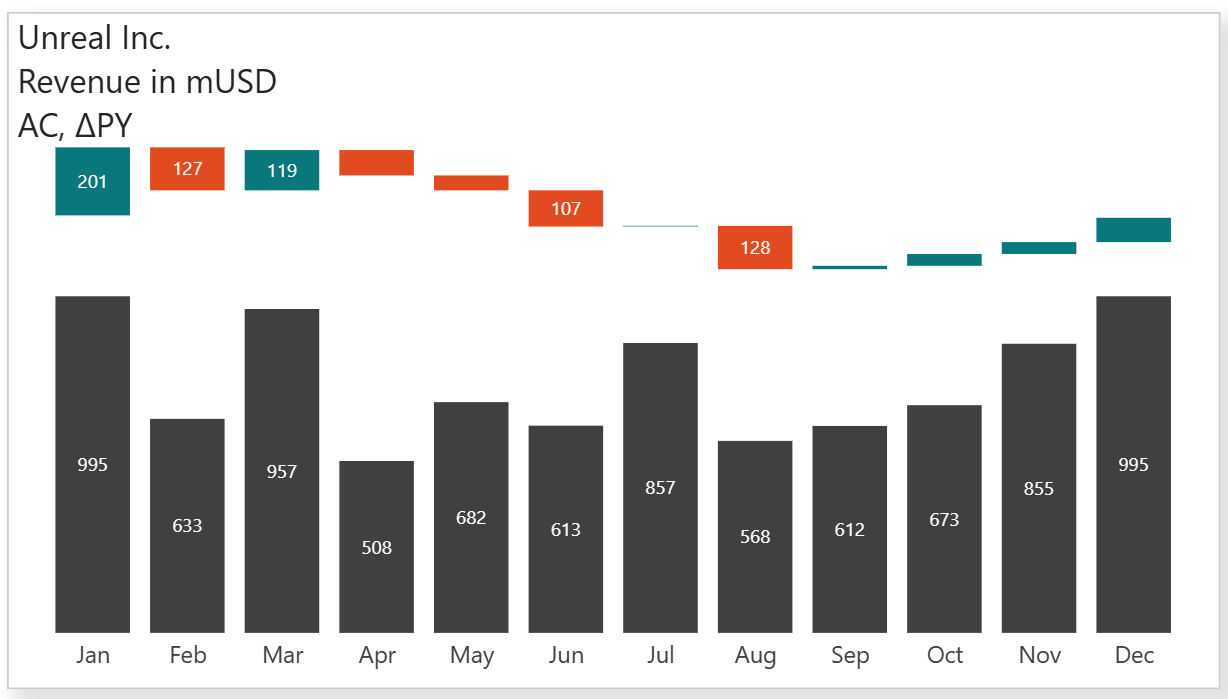
Image – native stacked column chart, created with:
- Planning prompt to rebuild a button slicer with embedded SVGs into a native stacked column chart and add a waterfall on the top instead of simple variance bars; plan execution.
- 1 prompt to fix an error – AI used the wrong name for the native visual in the JSON code because I asked to use “stacked column chart,” and AI literally used “stackedColumnChart,” which is an incorrect internal name for the visual.
- 1 prompt to fix the waterfall positioning and add data labels.
- 1 prompt to update the subtitle and axis titles, and labels.
- 2 prompts to fix waterfall positioning once again (got ruined in the previous step because of how the running total required for the waterfall is calculated with month numbers vs month names).
- 1 prompt to fix the title/subtitle (because the original 3-row title/subtitle was created using the title only, and I told AI to change the “subtitle” earlier, so it literally added the subtitle on top of the already existing 3-row title).
Prompts were intentionally short and lazy, without much detail, without telling AI what methods to use, and without telling it to fix all issues in one longer prompt, with the purpose of better testing AI reasoning. All calculations and measures required to build the waterfall (e.g., invisible bars for proper waterfall positioning) were 100% AI. I just told it to add white space between AC and the waterfall for proper positioning and to make sure the waterfall bar begins where the previous bar ended. There was no goal to reproduce the original chart as is; I deliberately asked it to build a waterfall instead of simple variance bars.
Model: Claude Opus 4.6 in VS Code GitHub Copilot.
This beast is smart. You may not look into the code anymore, but you still need to understand what you want to achieve, how the result should look and work, and why it’s needed (or not) to solve real-life problems.