WoW 2025 Week 24 | Power BI Core Slicers Box Plot
I don’t often join Workout Wednesday, but when I do, I prefer unconventional solutions. This week, WoW is about PBI Core Visuals, but slicers are visuals, aren’t they?
Ladies and gentlemen, let me present the Button Slicer Box Plot!
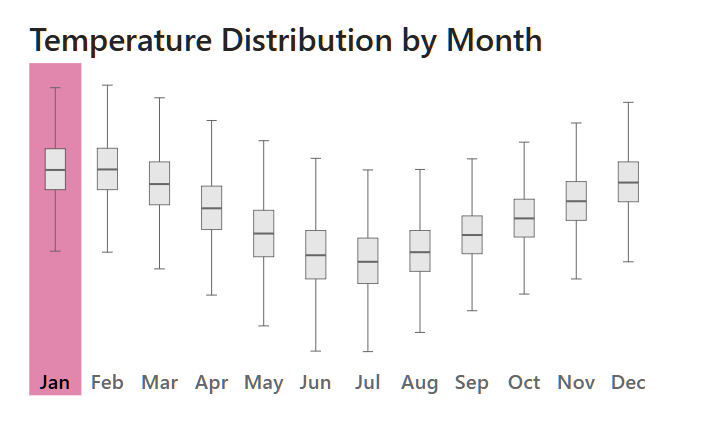
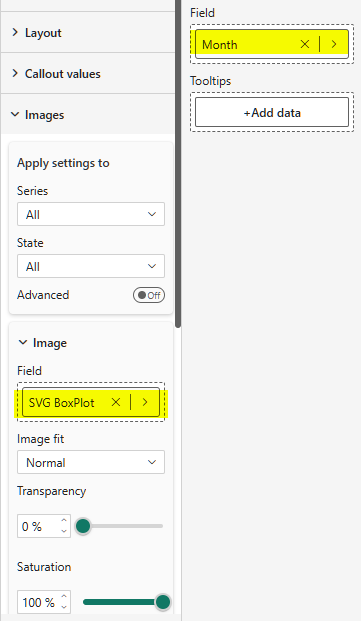
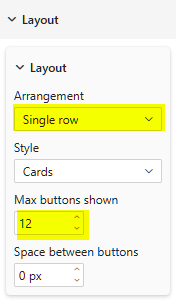
This is Button Slicer core visual

with 12 buttons (for Jan-Dec months) and embedded SVG images generated by [SVG BoxPlot] measure:
// Generate SVG image of Box Plot
//Copyright: Andrzej Leszkiewicz
// LinkedIn: https://linkedin.com/in/avatorl
// INPUTS ===
VAR _Height = 550 — px
VAR _Width = 100 — px
VAR _Scale =
CALCULATE (
( [1.5 IQR Temperate Axis Upper Limit] – [1.5 IQR Temperate Axis Lower Limit] ) / _Height,
ALLSELECTED ( ‘Date’ )
)
VAR _Min =
ROUNDDOWN (
CALCULATE ( [1.5 IQR Temperate Axis Lower Limit], ALLSELECTED ( ‘Date’ ) ) / _Scale,
0
)
VAR _MixShift =
MINX ( { _Min, 0 }, [Value] )
VAR _WhiskerLow =
_Height + _MixShift
– ROUND ( [1.5 IQR Temperature (Lowest)] / _Scale, 0 )
VAR _WhiskerHigh =
_Height + _MixShift
– ROUND ( [1.5 IQR Temperature (Highest)] / _Scale, 0 )
VAR _1stQuartile =
_Height + _MixShift
– ROUND ( [1st Quartile Temperature] / _Scale, 0 )
VAR _Median =
_Height + _MixShift
– ROUND ( [Mean Temperature] / _Scale, 0 )
VAR _3rdQuartile =
_Height + _MixShift
– ROUND ( [3rd Quartile Temperature] / _Scale, 0 ) //
// SVG OUTPUT ===
VAR _SVG_URLPrefix = “data:image/svg+xml;utf8,”
VAR _SVG_Open = “<svg xmlns=””http://www.w3.org/2000/svg”” width='” & _Width & “‘ height='” & _Height & “‘ >”
VAR _SVG_Close = “</svg>”
VAR _SVG_Box = “<rect x=’30%’ width=’40%’ y='” & _3rdQuartile & “‘ height='” & ( _1stQuartile – _3rdQuartile ) & “‘ stroke=’#000000′ stroke-width=’1′ fill=’#e6e6e6’ />”
VAR _SVG_WhiskerHigh = “<line x1=’50%’ y1='” & _WhiskerHigh & “‘ x2=’50%’ y2='” & _3rdQuartile & “‘ stroke=’#666666′ stroke-width=’2’ />”
VAR _SVG_WhiskerLow = “<line x1=’50%’ y1='” & _1stQuartile & “‘ x2=’50%’ y2='” & _WhiskerLow & “‘ stroke=’#666666′ stroke-width=’2’ />”
VAR _SVG_WhiskerHighEnd = “<line x1=’40%’ y1='” & _WhiskerHigh & “‘ x2=’60%’ y2='” & _WhiskerHigh & “‘ stroke=’ #666666′ stroke-width=’2′ />”
VAR _SVG_WhiskerLowEnd = “<line x1=’40%’ y1='” & _WhiskerLow & “‘ x2=’60%’ y2='” & _WhiskerLow & “‘ stroke=’ #666666′ stroke-width=’2′ />”
VAR _SVG_Median = “<line x1=’30%’ y1='” & _Median & “‘ x2=’70%’ y2='” & _Median & “‘ stroke=’ #666666′ stroke-width=’4′ />”
VAR _SVG = _SVG_URLPrefix & _SVG_Open & _SVG_Box & _SVG_Median & _SVG_WhiskerHighEnd & _SVG_WhiskerLowEnd & _SVG_WhiskerHigh & _SVG_WhiskerLow & _SVG_Close
RETURN
_SVG
Live Power BI report
All visuals used in the report:
➡️Button Slicer with SVG Box Plot
➡️Table
➡️Card (new) with SVG map of New Zeeland
PBIX file: https://github.com/avatorl/PowerBI-SVG/tree/main/button-slicer-svg