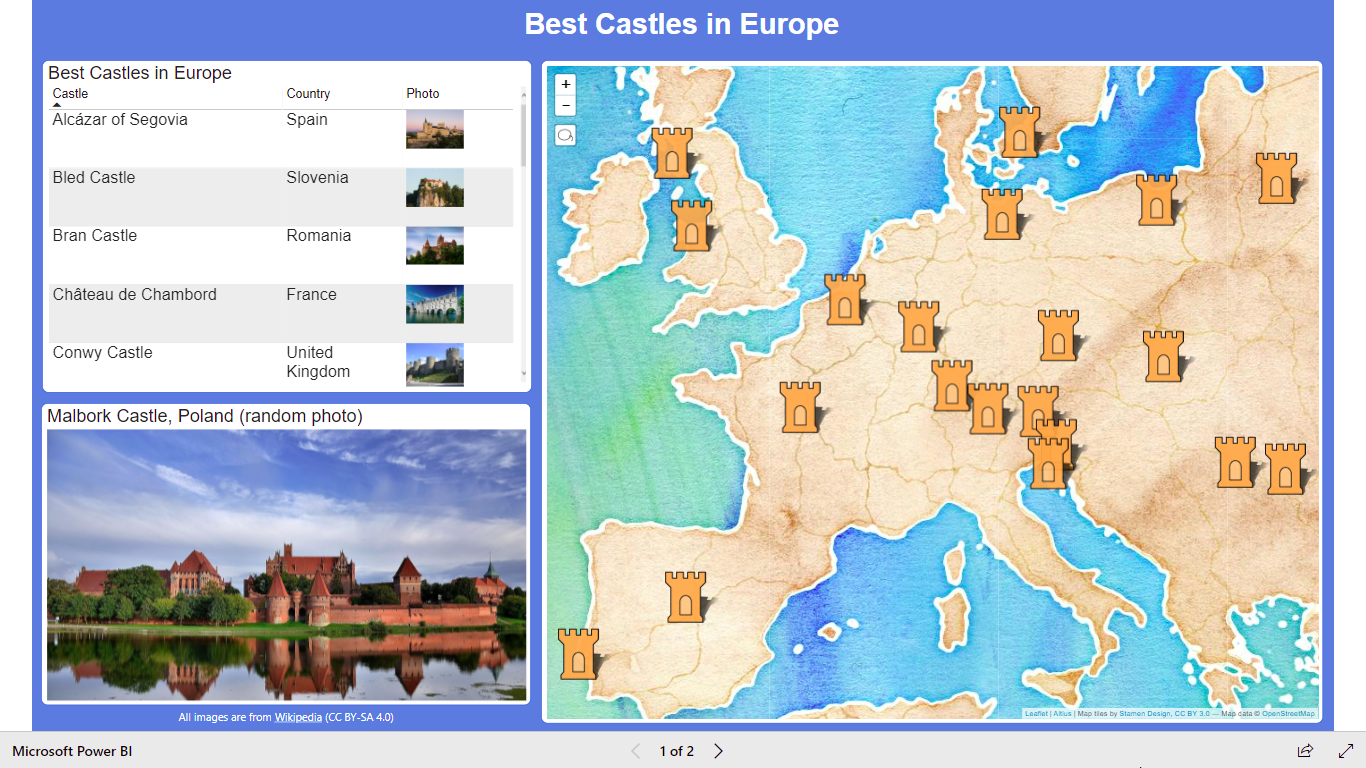
Power BI Report: Map with custom markers and images
Today I’m going to show you how to create a map with custom markers (castle icon) and images (on tooltips).
I created a simple one table dataset with a list of 20 castles in Europe (castle name, latitude and longitude, image URL, Wikipedia page URL).

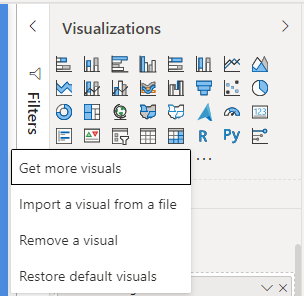
Then I installed two custom visuals:
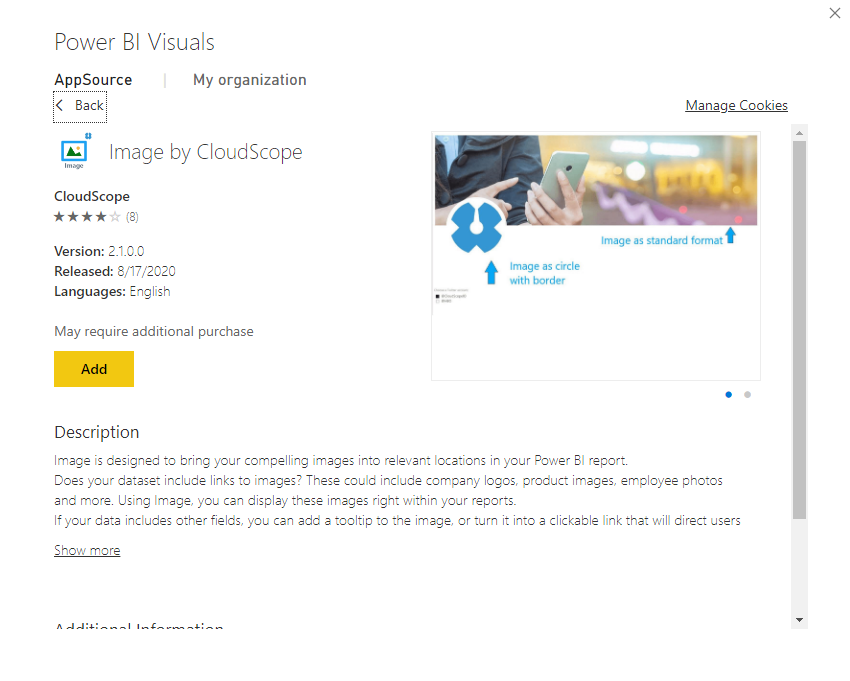
Image by CloudScope (from AppSource, using “Get more visuals” menu item)
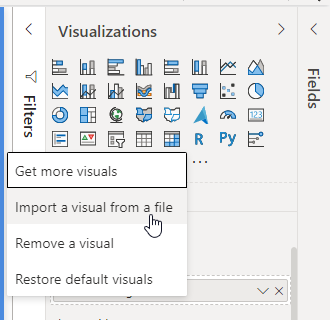
And Icon Map. There is Icon Map by Altius visual in AppSource, but it’s a 3 years old version, so I used “Import visual from a file” menu item to import a .pbiviz file (https://icon-map.com/pbiz/IconMap.pbiviz) from https://icon-map.com/ web site. It’s a new beta version of the same visual.
Icon Map is one of the best map visuals for Power BI. I’ll need to write a lot of articles to show all capabilities and settings of this visual. For this simple report I used just a few of them.
I inserted Icon Map visual into the report page and added the following fields:
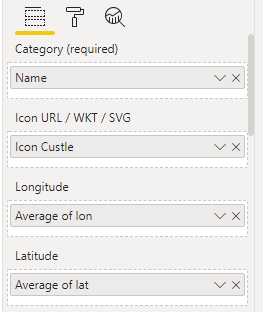
Category (required): castle[Name] column
Icon URL / WKT / SVG: [Icon Castle] measure (returns URL of an SVG image with a castle icon). This is for the map markers.
Icon Custle :=“https://upload.wikimedia.org/wikipedia/commons/7/74/Icone_chateau_fort.svg”

Longitude: Average of castle[lon] – longitude
Latitude: Average of castle[lat] – latitude
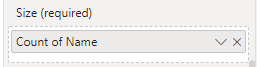
Size (required): Count of castle[Name] – count of castle name will always be 1 (I don’t need different marker sizes on the map, but the field is mandatory)
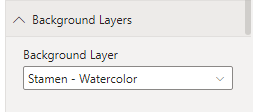
Then I update the following formatting settings:
Selected ‘Stamen – Watercolor’ as a background layer (map). The visual support a lot of other maps (different styles of Open Street Map, Stamen, Mapbox, Thunderforest maps and custom maps).
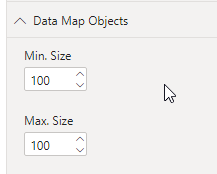
I increased Data Map Objects (map markers, or castle icons in my case) size to 100:
And I enable custom (report page) tooltips:
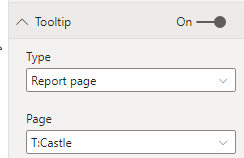
Where T:Castle a tooltip report page I create earlier.
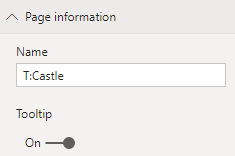
T:Castle page is very simple:
It’s a tooltip page (Tooltip option enabled)
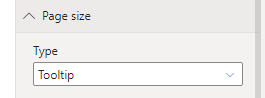
And Page size = Tooltip (320×240)
And there are 3 visuals on the page:
A card on the top to show [T:Castle] measure value (returns selected castle name or empty string):
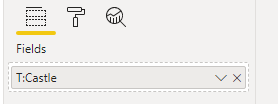
SELECTEDVALUE ( ‘castle'[Name], “” )
A car on the bottom to show [T:Country] measure (returns selected country name or empty string):
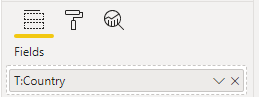
SELECTEDVALUE ( ‘castle'[Country], “” )
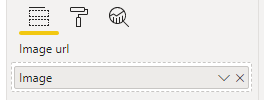
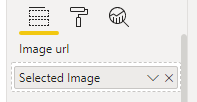
And Image by CloudScope visual to show a castle image (I added castle[Image] column to the Image url field):

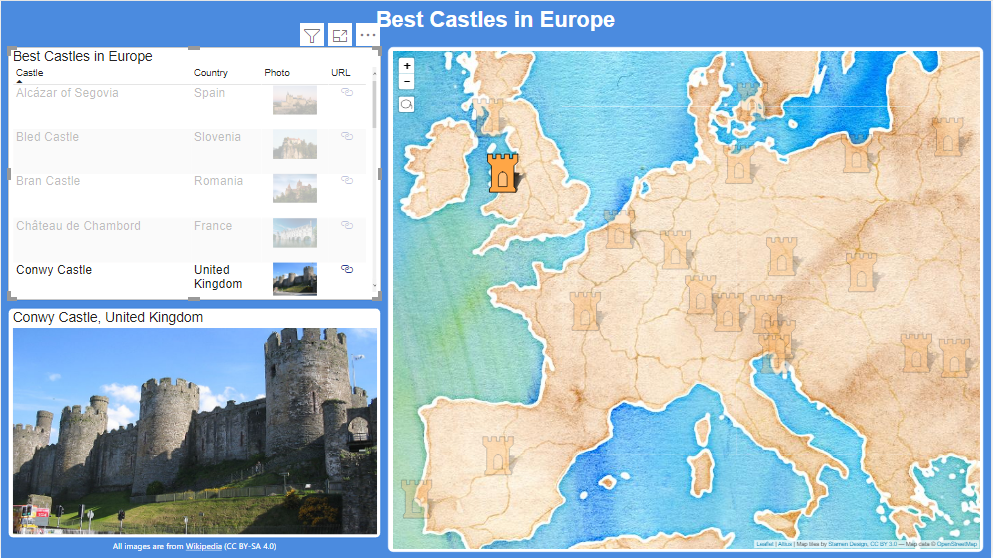
On the main report page (Best Castles in Europe) I also added a table (with castle name, country name, castle photo and a link to Wikipedia page):
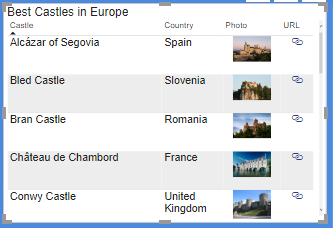
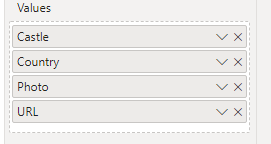
The table includes the following columns (added to the Values field): castle[Name] (Castle), castle[Country] (Country), castle[Image] (Photo), castle[Wikipedia] (URL):
I won’t be describing minor formatting settings (like font sizes) here, but there are a few important settings:
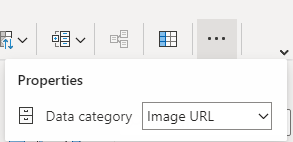
castle[Image] column data category must be changed to ‘Image URL’
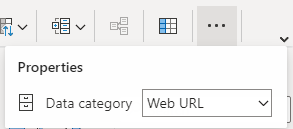
and castle[Wikipedia] column data category must be changed to ‘Web URL’
Then under Values group of the table formatting settings URL icon option must be enabled:
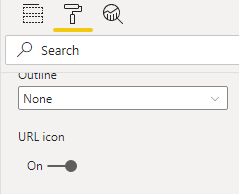
The above will make images visible in the table rows and will show links to the Wikipedia pages in the URL column.
Also I added Image by CloudScope visual to the main report page.
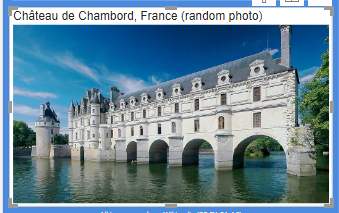
For this image visual I used [Selected Image]:
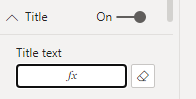
Also I used [Title: Castle Photo] measure for the title text:
To make these measures working I also added calculated column castle[Random] to the castle table and created [Random Castle] measure.
Calculated columns contains a random value (between 0 and 1):
Random =RAND ()
The random values then used to select a random castle:
Random Castle :=SELECTCOLUMNS ( TOPN ( 1, castle, [Random], ASC ), “castle”, [Name] )
This measure returns either an image of the selected castle or (if one castle is not selected) an image of the random castle (selected by the [Random Castle] measure):
Selected Image :=VAR _rand = [Random Castle]
VAR _castle =
IF (
HASONEVALUE ( castle[Name] ),
//selected castle
SELECTEDVALUE ( castle[Image] ),
//else random castle
SELECTCOLUMNS (
FILTER ( ALL ( castle ), castle[Name] = _rand ),
“image”, [Image]
)
)
RETURN
_castle
And this measure is similar, but returns a title for the image (country name + country name) using the same approach (either selected castle or random):
Title: Castle Photo :=VAR _rand = [Random Castle]
VAR _castle =
IF (
HASONEVALUE ( castle[Name] ),
//selected castle
SELECTEDVALUE ( castle[Name] ) & “, “
& SELECTEDVALUE ( castle[Country] ),
//else random castle
SELECTCOLUMNS (
FILTER ( ALL ( castle ), castle[Name] = _rand ),
“title”,
[Name] & “, “ & [Country] & ” (random photo)”
)
)
RETURN
_castle
The random image will reset only during dataset refresh because it’s based on the calculated column.
Now we can select a castle in the table:
Live report:
And I’m attaching the .pbix file.