Dashboards with Better User Experiences
Features useful for creating better user experiences:
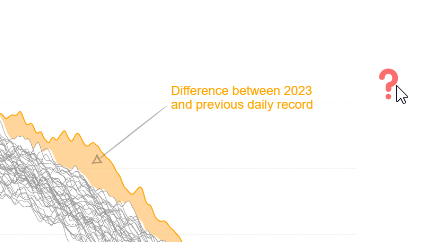
➡️ Legends, labels that become visible during a mouse hover event over a chart element. For example, hover the cursor over the reddish question mark in the Climate Change report v.4
➡️ A slicer (or a filter pane filter) that enables/disables legends and other visual clues, tailored for new users but considered redundant by experienced users familiar with the report.
➡️ A slicer (filter) + RLS with a user group that includes new users to make all visual clues enabled by default during a training period (users are in the group) and disabled by default after the training period (users removed from the group).
➡️ The same RLS-based feature can be used to enable more accessible versions of the reports by default for certain users.
➡️ Visual clues that are visible by default and disappear on a timer event or after user interaction with the element (see the video – a red vertical line becomes black and the red label disappears after the first user interaction with the line).
Not everything is available with core visuals alone; Deneb and Vega provide greater control over the user experience.
Vega event streams can be utilized to create visual elements that respond to timer or pointer events.
In the Florence Nightingale’s Rose Diagram example, dividerMouseDragX captures the “x” position of the vertical line as it is dragged left or right. The showDividerText variable changes from its default value of true to false when the vertical line is moved more than 10 pixels to the right for the first time. This change in showDividerText is then utilized to hide the red label and alter the line’s color from red to black.
“signals”: [
{
“name”: “showDividerText”,
“description”: “will be set to false when the split screen divider line moved to right. used to hide the line.”,
“value”: “true”,
“update”: “(showDividerText&÷rMouseDragX>-190)?false:showDividerText”
},
{
“name”: “dividerMouseDragX”,
“description”: “x position of the split screen divider line”,
“init”: “-200”,
“on”: [
{
“events”: “[@rule-divider-wide:pointerdown, window:pointerup] > window:pointermove”,
“update”: “round(clamp(x(),-200,835))”,
“force”: true
}
]
}
]
Full Vega JSON: https://github.com/avatorl/Deneb-Vega/tree/main/nightingale-rose
To link Vega visualization with a slicer (filter) outside of the Deneb visual, you can create a measure to retrieve a value from a slicer (filter) and incorporate it into the Deneb “dataset,” where the entire column will contain the same value, such as 1 or 0. Then, use a signal to extract a single value from the column. Based on this value, certain visual elements can be shown or hidden.

"signals": [
    {
      "name": "groupLegendState",
      "description": "Extracts first value from 'Legend On/Off' column. Expected values: 0 or 1. 0 - legend hidden, 1 - legend visible",
      "update": "data('dataset')[0]['Legend On/Off']"
    }
]