Fabric Deployment Pipeline Rule to set Data Pipeline Parameters
+ Deployment Stage Conditional Formatting in Power BI Reports I probably should give the Fabric Variable libraries (preview) a try. But a preview is essentially … Read More
Power of Business Intelligence
Blog by Andrzej Leszkiewicz. Power BI Developer and Consultant.
Power of Business Intelligence
Blog by Andrzej Leszkiewicz. Power BI Developer and Consultant.
+ Deployment Stage Conditional Formatting in Power BI Reports I probably should give the Fabric Variable libraries (preview) a try. But a preview is essentially … Read More
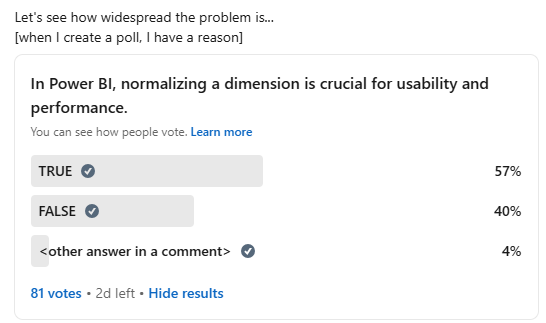
Okay, Power BI community, we have a problem. 80+ votes is already enough to confirm that we indeed have a problem. “In Power BI, normalizing … Read More
🛑Coca-Cola reports = red in the reports🛑Starbucks reports = green-bluish in the reports. No! BI <> BI. In business intelligence, “business identity” is the last … Read More
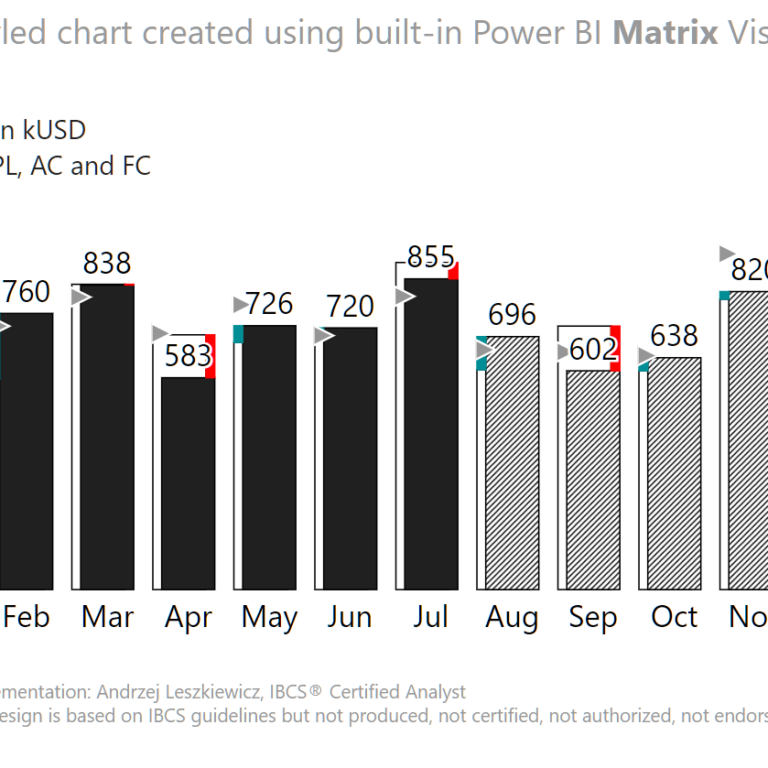
I’ve published a Power BI report with an example of a chart based on International Business Communication Standards. Live Power BI report: https://www.powerofbi.org/international-business-communication-standards/.
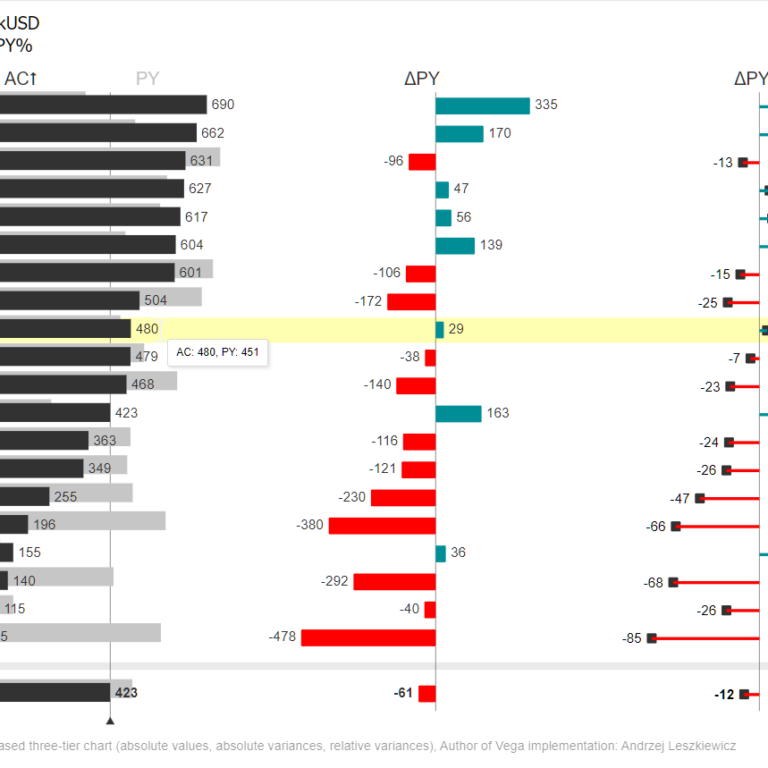
After all the struggle with native Power BI visuals (their limitations) Deneb-Vega gives you a real power. Probably for someone who worked with JavaScript from … Read More
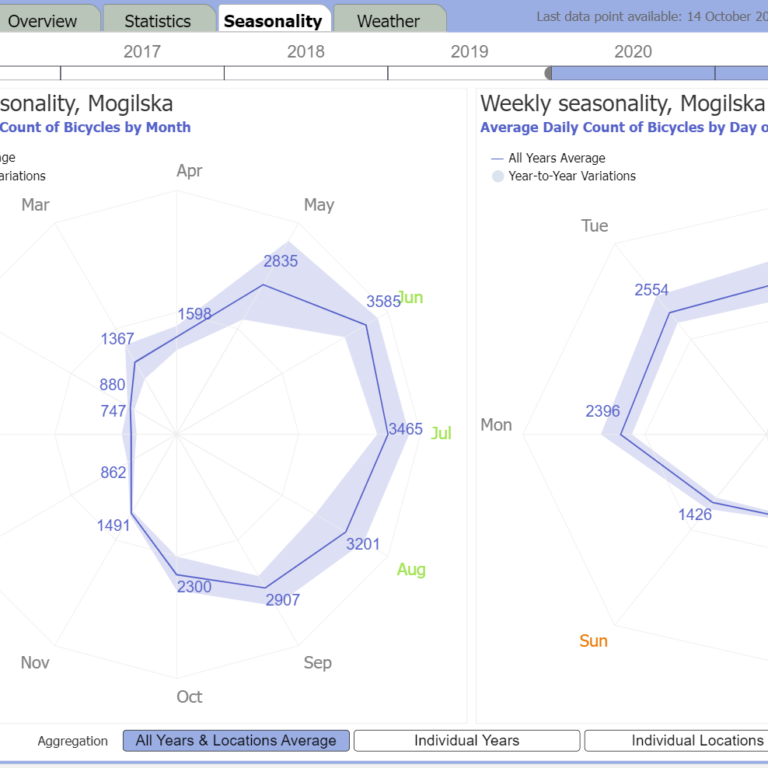
After some experiments I have just published new version of the Seasonality page of my experimental showcase Krakow Bicycle Counters report. Also I’ve shared the … Read More
I’ve already read many data visualization books, including The Big Book of Dashboards. And I was expecting high quality book from Steve Wexler. But this … Read More
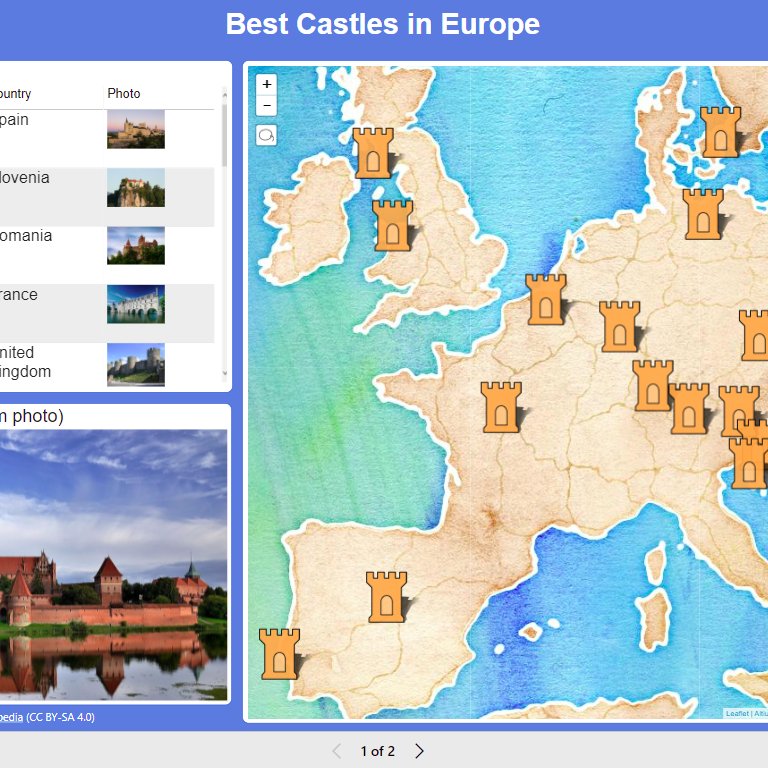
Today I’m going to show you how to create a map with custom markers (castle icon) and images (on tooltips). I created a simple one … Read More
It’s a client requirement. The customer is always right. Or not. A client of a restaurant doesn’t ask a chef to cook using client’s recipe. … Read More
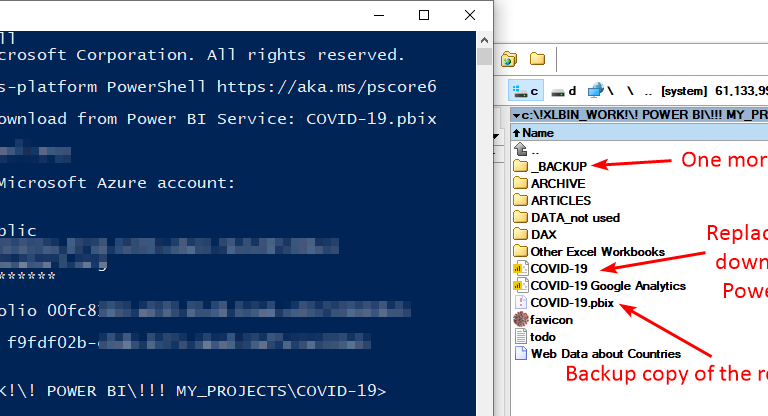
What if I need to download .pbix file from Power BI service? I’ll need it if a report has been edited in Power BI Service … Read More